


New Perspective on Vegetation Phenology Variability Based on Tibetan Plateau Tree-ring Data
Updatetime:2017-06-20From:
【Enlarge】【Reduce】
How vegetation phenology on the Tibetan Plateau (TP) , the earth's largest surface area above 4000 m asl., responds to climate change, in particular to rising temperature, has attracted much attention during recent years. An increase of growth activity of high-elevation vegetation on the TP may have a considerable impact on the regional carbon budget.
One widely-used method for the vegetation phenology is collection of satellite remote sensing data. However, divergent results from analysis of remote sensing results have been obtained regarding the rate of changes in spring phenology and its relation to climatic drivers on the TP. Furthermore, the length of the satellite remote sensing records is rather short, covering only the last 30 years, significantly limiting the statistical confidence we can place in such methods of trend detection. A dataset that covers a much longer period is thus needed to resolve current disagreements.
Recently, a research group of Prof. YANG Bao from the Key Laboratory of Desert and Desertification, Northwest Institute of Eco-Environment and Resources of the Chinese Academy of Sciences together with the coauthors from Russia, Germany, Canada and Sweden reconciles these conflicting results based on a 55 year-length series of vegetation phenology for the TP derived from well-validated process-based Vaganov-Shashkin model (V-S) simulations of tree-ring growth data. The results are now published in the journal PNAS with the title of New Perspective on Spring Vegetation Phenology and Global Climate Change Based on Tibetan Plateau Tree-ring Data.
The authors found that the start of the growing season (SOS) has advanced on average by 0.28 days/year over the period 1960–2014. The end of the growing season (EOS) has been delayed, by an estimated 0.33 days/year during 1982–2014. No significant changes in SOS or EOS were observed during 1960–1981. April–June and August–September minimum temperatures are the main climatic drivers for SOS and EOS, respectively. An increase of 1°C in April–June minimum temperature shifted the dates of xylem phenology by 6–7 days, lengthening the period of tree-ring formation.
This approach could further be extended to other forested regions of the world. Scaling up the analysis would provide additional information on phenological responses of terrestrial ecosystems to the ongoing climate change across the Northern Hemisphere.
The lead authors (Bao Yang and Minhui He) of this research are financially supported by the National Natural Science Foundation of China (Grant No. 41520104005, 41325008, and 41661144008) and the Alexander von Humboldt Foundation.
Reference:
Yang B, He MH, Shishov V, Tychkov I, Vaganov EA, Rossi S, Ljungqvist FC, Bräuning A, Grießinger J. 2017: New perspective on spring vegetation phenology and global climate change based on Tibetan Plateau tree-ring data. PNAS. doi/10.1073/pnas.1616608114
Contact:
YANG Bao, HE Minhui
E-mail: yangbao@lzb.ac.cn, hmh0503lb@163.com
Key Laboratory of Desert and Desertification, Northwest Institute of Eco-Environment and Resources, Chinese Academy of Sciences, 730000 Lanzhou, China.
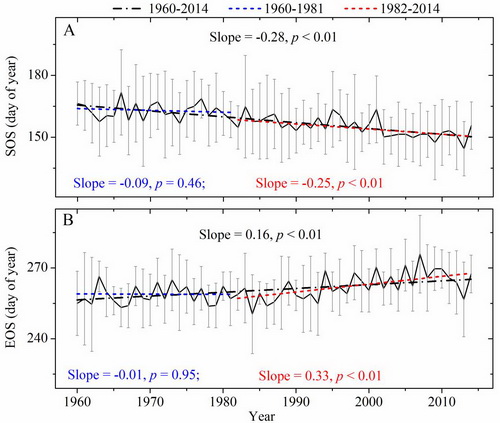
Fig. 1 Characteristics of all the averaged SOS (A) and EOS (B) on the entire study region during the period 1960–2014. Dashed lines indicate linear trends for the periods 1960–2014 (black line), 1982–2014 (red line) and 1960–1981 (blue line), respectively. Error bars indicate standard deviation among the 20 composite sites. (Image by YANG Bao)

Fig. 2 Comparison of our simulated SOS and EOS with the respective series derived from remote sensing data. A: Shen et al. 2015’s spring vegetation green-up dates: from 1982 to 1999, which was determined from the AVHRR NDVI data using five different methods; for 2000–2011, which was extracted with the same five methods from NDVIs observed by AVHRR, MODIS and SPOT and on the MODIS EVI. Zhang et al. 2013’s spring vegetation green-up dates consist of three time spans: from 1982 to 1997, which was derived from the AVHRR NDVI data; for 1998–1999, which was retrieved from AVHRR and SPOT NDVI data; for 2000–2011, which was determined from NDVI datasets observed by MODIS and SPOT. B: Che et al. 2014 is the inter-annual variations of averaged end dates of vegetation growing season extracted from AVHRR Leaf Area Index data across the TP during the period 1982–2011. Yu et al. 2010 is the variations of averaged end dates of vegetation (meadow) growing season extracted from AVHRR NDVI across the TP. (Image by YANG Bao)
Appendix
